Tracking Your Heart Health Progress: Metrics That Matter
Andrew founded Renew Health to change how cardiovascular disease is detected and treated.
Heart disease remains the leading cause of death in the US — about 695,000 people lose their lives to it each year. The unsettling part? Many of the warning signs stay invisible until something serious happens.
Here's what most people don't realize: your annual checkup might look "normal," yet your heart could be struggling silently. Standard tests often miss the early signals — the ones that show up long before symptoms appear. The good news is that tracking the right metrics gives you a window into your heart health that a single office visit simply can't provide.
Why Does Standard Care Miss Early Warning Signs?
When you visit your doctor for a routine physical, you probably get your blood pressure checked and maybe some blood work. These snapshots matter — but they only capture one moment in time. The reality is that your heart tells a much bigger story through daily patterns, recovery signals, and subtle variations that happen between visits.
High blood pressure, poor sleep, rising blood sugar, and even hours of sitting can quietly strain your cardiovascular system. These changes accumulate over months and years, gradually increasing your risk for heart attack, stroke, or heart failure. By the time symptoms appear, significant damage may already exist.
The gap in conventional care is clear: it focuses on single measurements rather than trends. A blood pressure reading of 128/82 might fall within "normal" range — but if it's swinging dramatically from morning to night, that variability itself signals elevated risk. This is why tracking heart health progress over time reveals patterns that isolated readings completely miss.
What Does the Research Tell Us About Heart Health Metrics?
Heart Rate Variability (HRV)
Your heart doesn't beat like a metronome — and that's actually a good sign. Heart rate variability measures the tiny fluctuations in time between each heartbeat. A higher HRV means your body can flexibly switch between activity and rest, reflecting a well-balanced autonomic nervous system.
Research confirms that HRV is a powerful predictor of mortality. A comprehensive meta-analysis of 32 studies and 38,008 participants found that lower HRV values were significant predictors of higher all-cause and cardiac mortality across different ages, sexes, and populations — with those in the lowest quartile of HRV facing 56% higher mortality risk (Jarczok et al., 2022; PMID: 36243195).
What lowers HRV? Poor sleep, chronic stress, heavy alcohol consumption, and overtraining all drag these numbers down. When your HRV stays low, it often means your body is operating in a persistent state of stress — even when you feel fine.
Heart Rate Recovery (HRR)
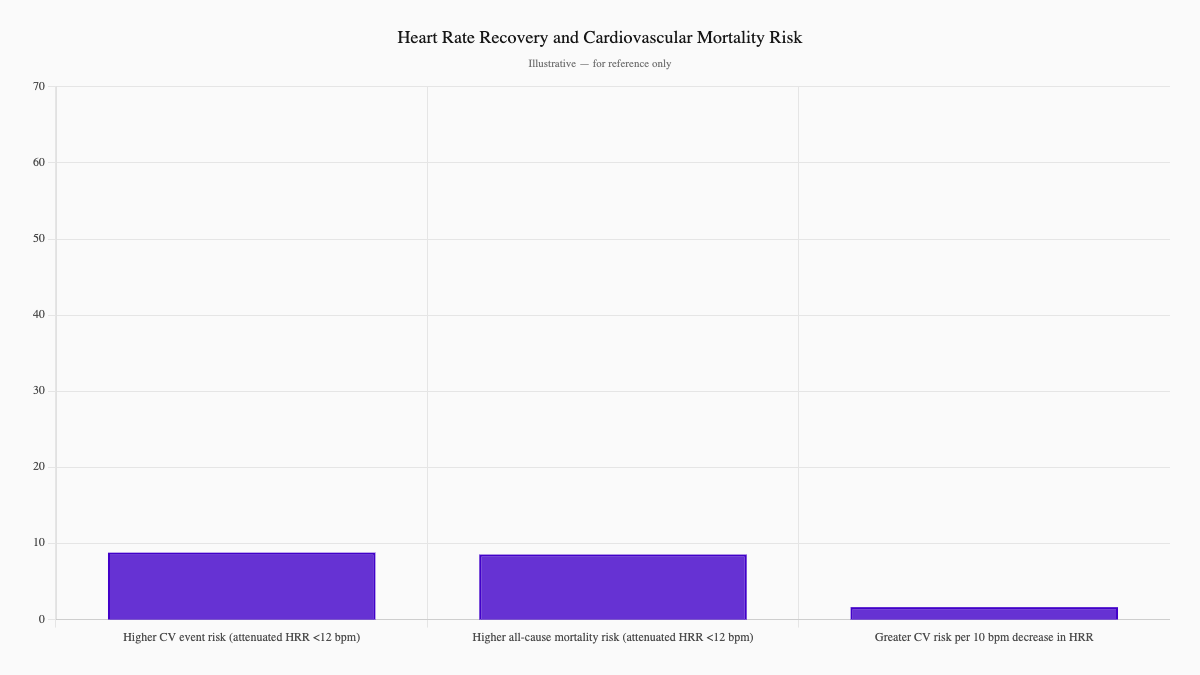
After you stop exercising, how quickly does your heart rate calm down? That recovery speed matters enormously. A healthy heart rate recovery means dropping at least 12 beats in the first minute after activity stops.
The evidence is striking: people with attenuated heart rate recovery face nearly 70% higher risk of cardiovascular events and 68% higher risk of all-cause mortality compared to those with fast recovery. Every 10-beat-per-minute decrease in HRR corresponds to a 13% greater cardiovascular risk and a 9% increase in all-cause mortality — independent of traditional metabolic risk factors (Qiu et al., 2017; PMID: 28487388).
Blood Pressure Variability (BPV)
Your blood pressure changes throughout the day based on stress, activity, sleep, and what you eat. Focusing only on the average reading misses critical information. Research confirms that blood pressure variability predicts poor outcomes, with higher systolic BPV linked to greater risk of functional disability, mortality, and early neurological deterioration (Chen et al., 2024; PMID: 38036920).
Someone whose blood pressure jumps from normal in the morning to elevated by evening may face greater risks than someone whose pressure stays steady — even if their average numbers look identical.
Sleep and Heart Health
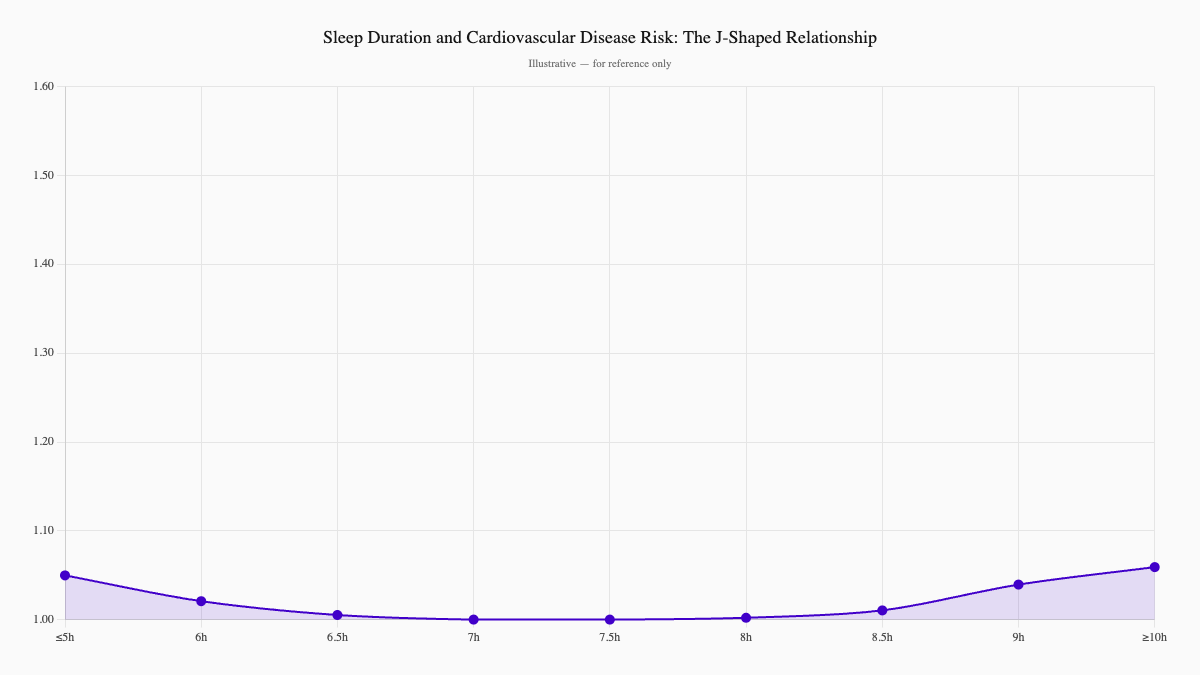
Sleep isn't just rest — it's active recovery time for your cardiovascular system. During deep and REM sleep, your heart rate slows, blood pressure drops, and stress hormones balance out. Research consistently shows that both short and long sleep duration increase risk for coronary heart disease, stroke, and total cardiovascular disease. A systematic review and meta-analysis of 15 prospective studies and nearly 475,000 participants confirmed these associations (Cappuccio et al., 2011; PMID: 21300732).
Adults should aim for 7–9 hours nightly, but quality matters as much as quantity. People with sleep apnea, who wake repeatedly throughout the night, face significantly higher risks for hypertension and heart disease.
What Happened When Marcus Started Tracking His Numbers?
Marcus, a 52-year-old executive, considered himself healthy. His annual physical showed nothing alarming — cholesterol slightly elevated, but nothing that raised his doctor's concern. He exercised occasionally, ate reasonably well, and slept about six hours a night.
"I thought I was fine," Marcus told us. "My checkups always came back normal."
After a wellness screening revealed borderline numbers, Marcus started wearing a fitness tracker to "pay more attention." Three months later, the data told a different story. His HRV trends showed significant drops on work-heavy weeks with poor sleep — his body was in chronic stress mode even when he felt productive and energetic.
His initial numbers told the tale:
- Resting heart rate: 78 bpm (elevated)
- HRV: 28 ms (low — indicating autonomic stress)
- Blood pressure: 138/88 (pre-hypertensive)
- Sleep: 5–6 hours nightly, fragmented
- Daily steps: 3,000–4,000
Working with his physician, Marcus made targeted changes: consistent 7–8 hour sleep schedules, walking meetings instead of conference room sessions, and short "exercise snacks" (2–3 minute walks every hour during workdays).
Six months later, his numbers told a new story:
- Resting heart rate: 62 bpm
- HRV: 52 ms
- Blood pressure: 122/78
- Daily steps: 8,000+
"The numbers told me what I couldn't feel," Marcus reflected. "My heart was struggling long before any symptoms appeared. Now I have data that actually helps me make better decisions every day."
What Warning Signs Might Your Numbers Be Sending?
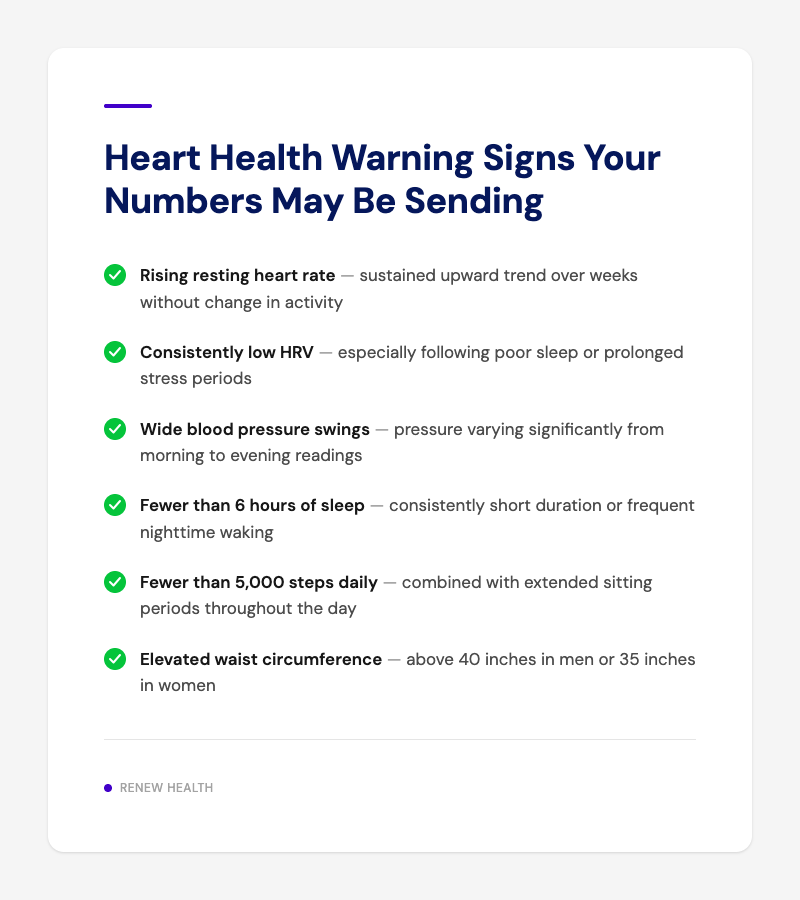
Pay attention to these patterns:
- Rising resting heart rate over weeks without any change in activity level
- Consistently low HRV, especially after poor sleep or prolonged stress
- Blood pressure that swings widely from morning to evening readings
- Fewer than 6 hours of sleep consistently, or frequent nighttime waking
- Fewer than 5,000 steps on a typical day with extended sitting periods
- Waist circumference above 40 inches (men) or 35 inches (women)
How Does Renew Go Beyond the Annual Checkup?
At Renew, we believe tracking heart health requires looking at the whole picture — not just single measurements. Our comprehensive cardiovascular assessment goes beyond standard lipid panels to include:
- Advanced lipid testing, including particle size analysis
- Carotid Intima-Media Thickness (CIMT) imaging to visualize early plaque formation before symptoms appear — learn more about CIMT
- Continuous glucose monitoring to understand blood sugar patterns throughout the day
- Wearable integration for tracking HRV, heart rate recovery, and sleep quality over time
We use technology that lets you monitor key metrics daily, then review trends with our clinical team. This approach catches developing problems years before they'd appear on a routine physical.
Our philosophy centers on prevention through personalization. Rather than waiting for numbers to reach "treatment thresholds," we help you understand your baseline, identify patterns, and make adjustments before damage accumulates.
What Evidence-Based Strategies Actually Improve Your Heart Numbers?
The research is clear: improving one metric often cascades into improvements across others. Here's what the evidence supports:
Movement Matters — But So Does Breaking Sitting
Regular exercise improves nearly every heart metric — lowering resting heart rate, improving HRV, supporting healthy blood pressure, and helping manage cholesterol and blood sugar. Guidelines recommend at least 150 minutes of moderate exercise (such as brisk walking) or 75 minutes of vigorous activity weekly.
But here's what many miss: prolonged sitting can undo exercise benefits, even if you hit your step goal later. Movement patterns matter as much as total volume. Standing every 30–60 minutes, taking walks after meals, and incorporating "exercise snacks" (brief bursts of movement) all contribute meaningfully to cardiovascular health.
Sleep Optimization
Prioritizing 7–9 hours of quality sleep directly impacts HRV, blood pressure, and inflammation markers. Consistency matters — going to bed and waking at similar times daily helps regulate your cardiovascular system's recovery cycles. Even a 30-minute improvement in sleep consistency can shift HRV in the right direction within weeks.
Nutrition That Protects
The DASH eating plan and Mediterranean-style diets both demonstrate benefits for heart health — lowering LDL cholesterol, reducing blood pressure, and improving insulin sensitivity. Focus on at least 450 grams of fruits and vegetables daily, two servings of fish weekly, and fewer than 1,500 mg of sodium daily. Limiting processed meats and sugary drinks makes a measurable difference over time.
What Are Your Next Steps?
Ready to understand your heart health more completely? Here's where to start:
- Get baseline measurements — advanced lipid panels, fasting glucose, and CIMT imaging give you the full picture. See our testing options.
- Track daily metrics using a wearable device that measures HRV and sleep quality.
- Review patterns over 2–3 months rather than focusing on single readings.
- Make one change at a time so you can clearly see what moves your numbers.
- Partner with a clinician who understands functional cardiovascular assessment.
Your heart has been sending you signals all along. Now you have the tools to hear them clearly.
Ready to see what's really going on with your cardiovascular health? Schedule a consultation and review your personalized heart metrics.
Sources
-
Jarczok MN, et al. Heart rate variability in the prediction of mortality: A systematic review and meta-analysis of healthy and patient populations. Neurosci Biobehav Rev. 2022 Dec;143:104907. PMID: 36243195
-
Qiu S, et al. Heart Rate Recovery and Risk of Cardiovascular Events and All-Cause Mortality: A Meta-Analysis of Prospective Cohort Studies. J Am Heart Assoc. 2017;6(5):e005505. PMID: 28487388
-
Chen Y, et al. Blood pressure variability predicts poor outcomes in acute stroke patients without thrombolysis: a systematic review and meta-analysis. J Neurol. 2024 Mar;271(3):1160–1169. PMID: 38036920
-
Cappuccio FP, et al. Sleep duration predicts cardiovascular outcomes: a systematic review and meta-analysis of prospective studies. Eur Heart J. 2011 Jun;32(12):1484–92. PMID: 21300732
Ready to see your actual risk?
Advanced metabolic testing, arterial imaging, and a personalized prevention plan — built around your numbers.
View Memberships